Advanced online exam analytics and reporting tools
Actionable insights and data visuals to track performance and refine exam content.
Trusted by professional organisations, awarding bodies, and universities worldwide
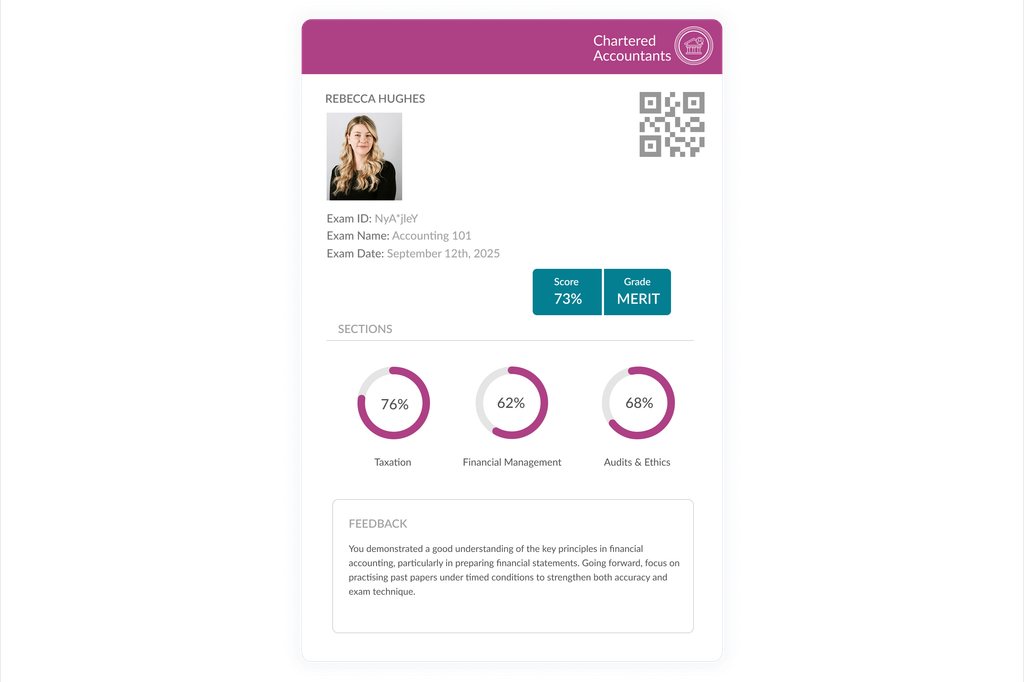
Candidate performance analytics
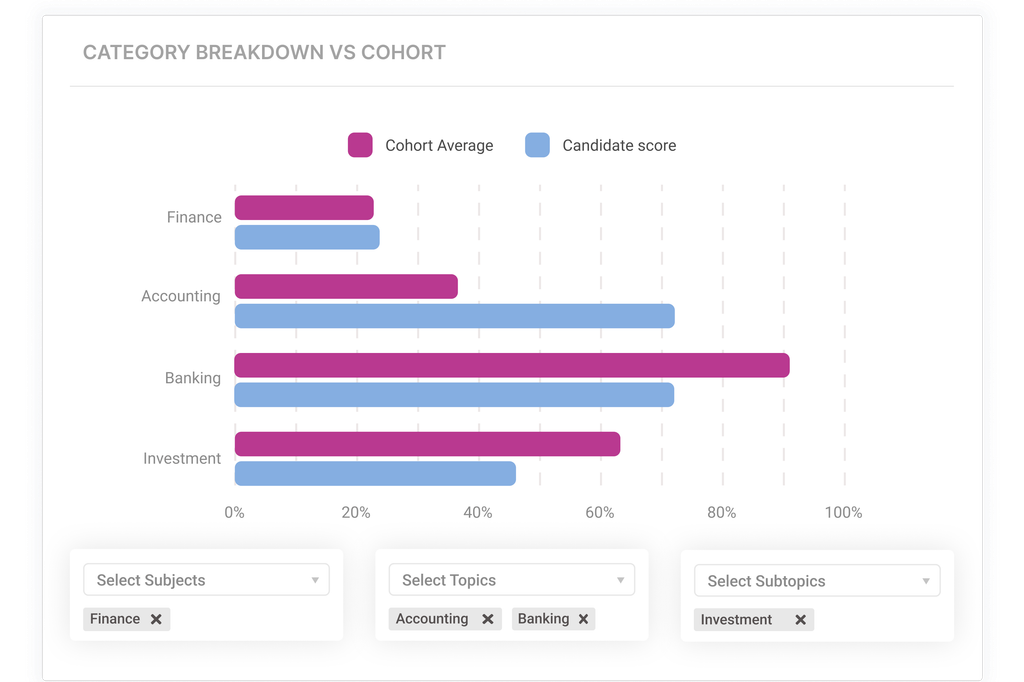
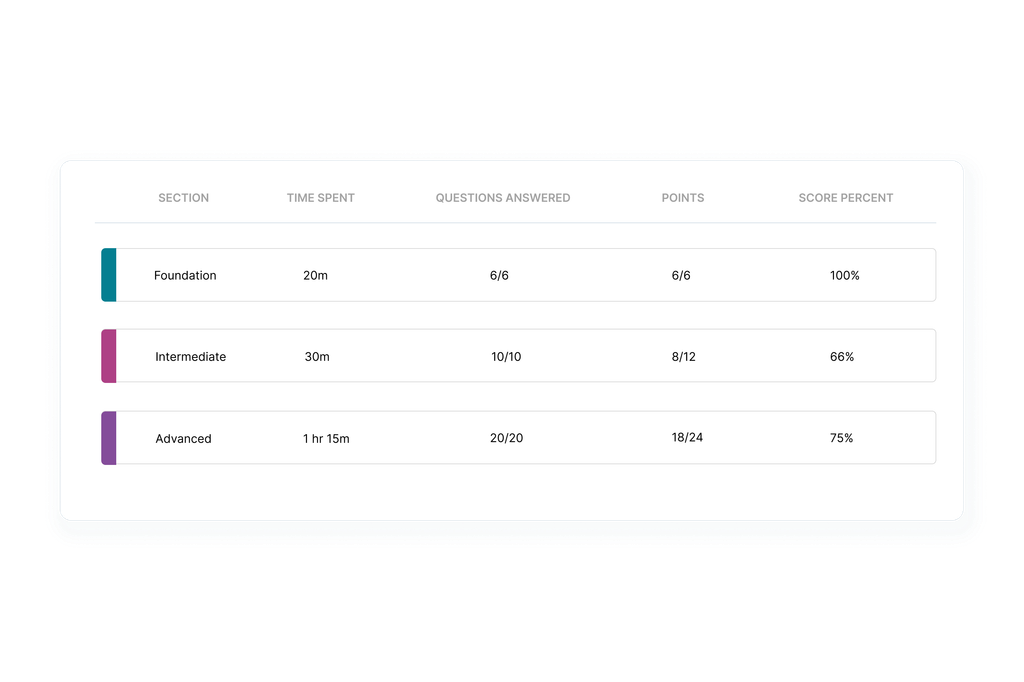
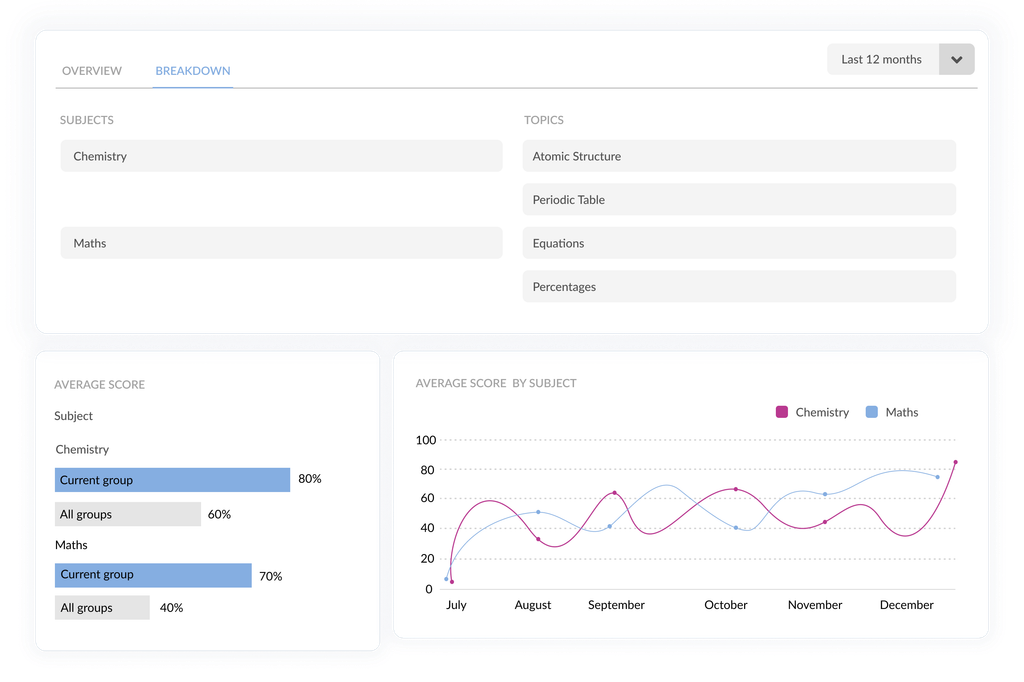
Category breakdown
Enhanced tagging and bar chart breakdown highlights candidate strengths and weaknesses at a glance. Compare performance across subjects, topics, subtopics, skills, and difficulty levels to pinpoint gaps and guide personalised feedback.
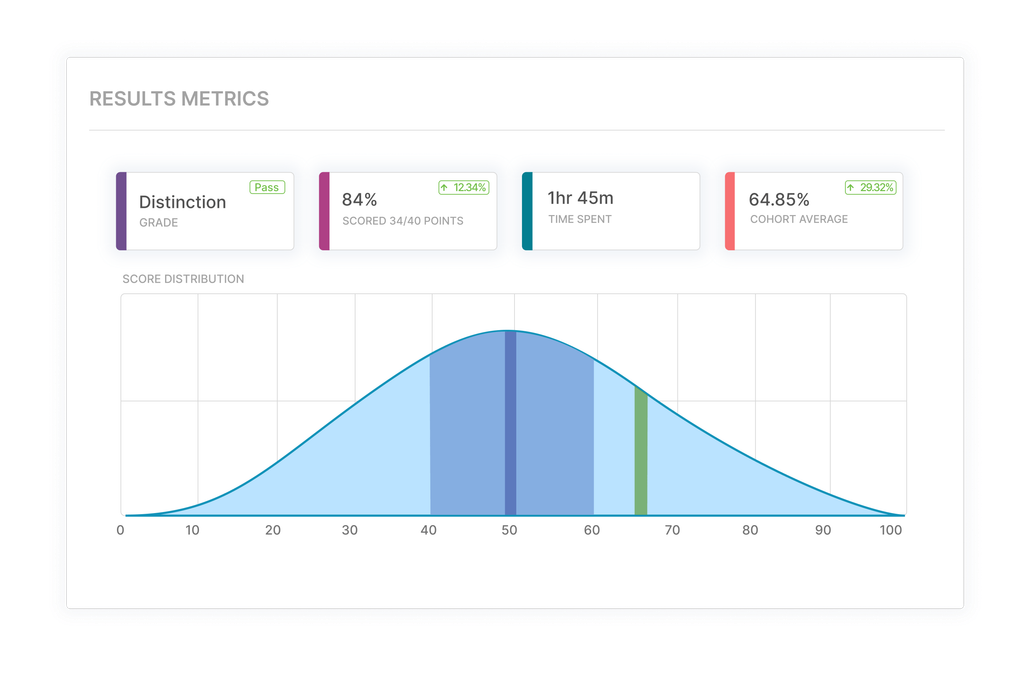

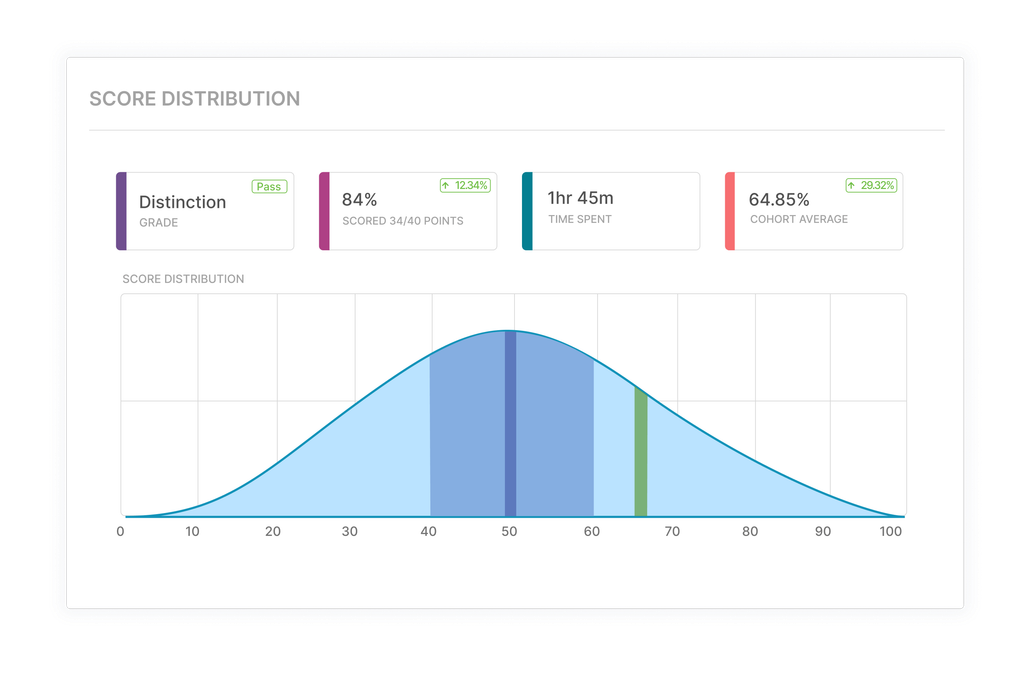
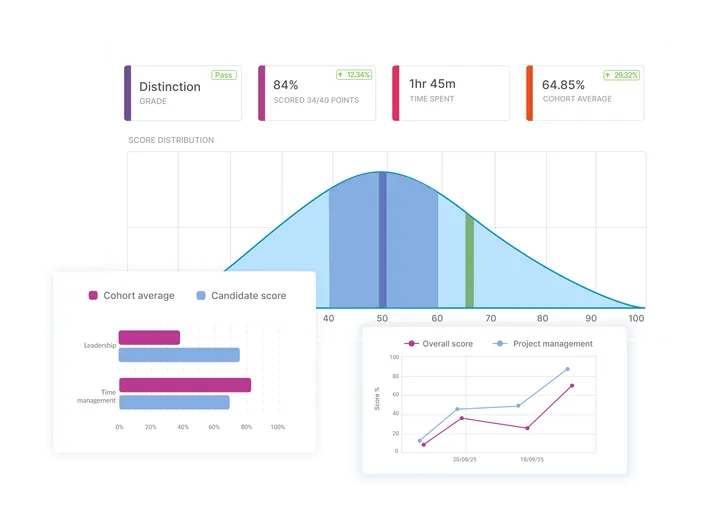
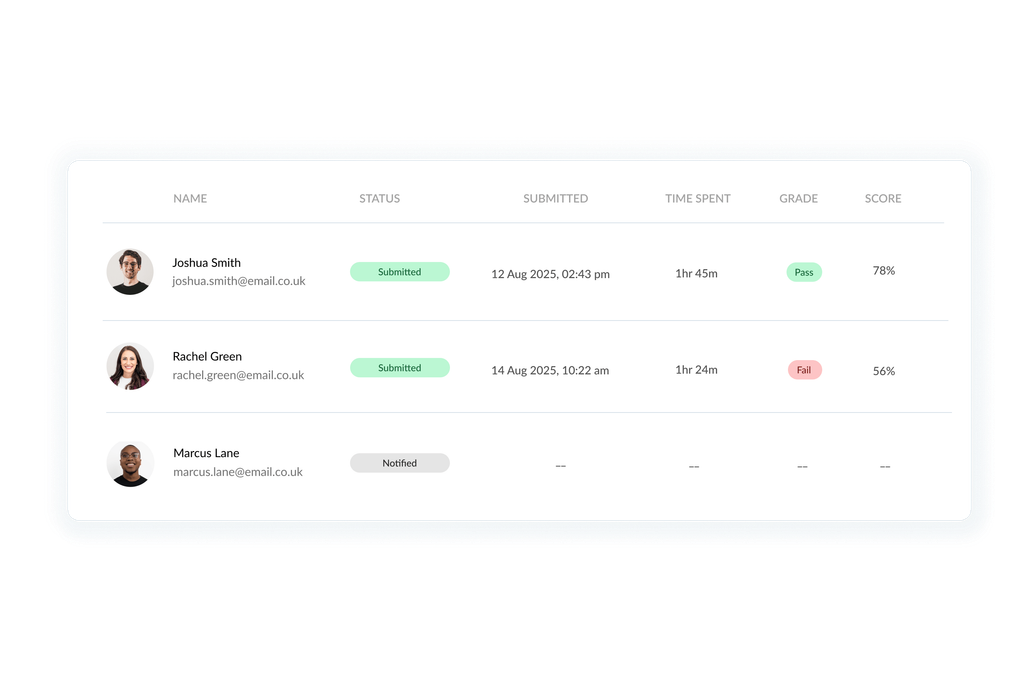
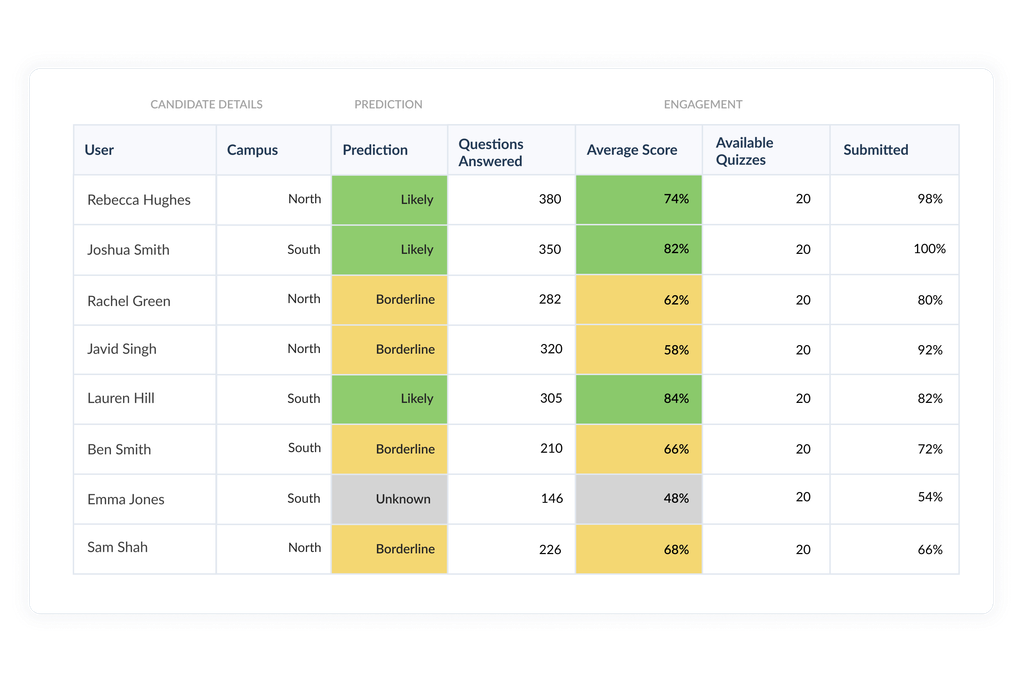
Candidate insights
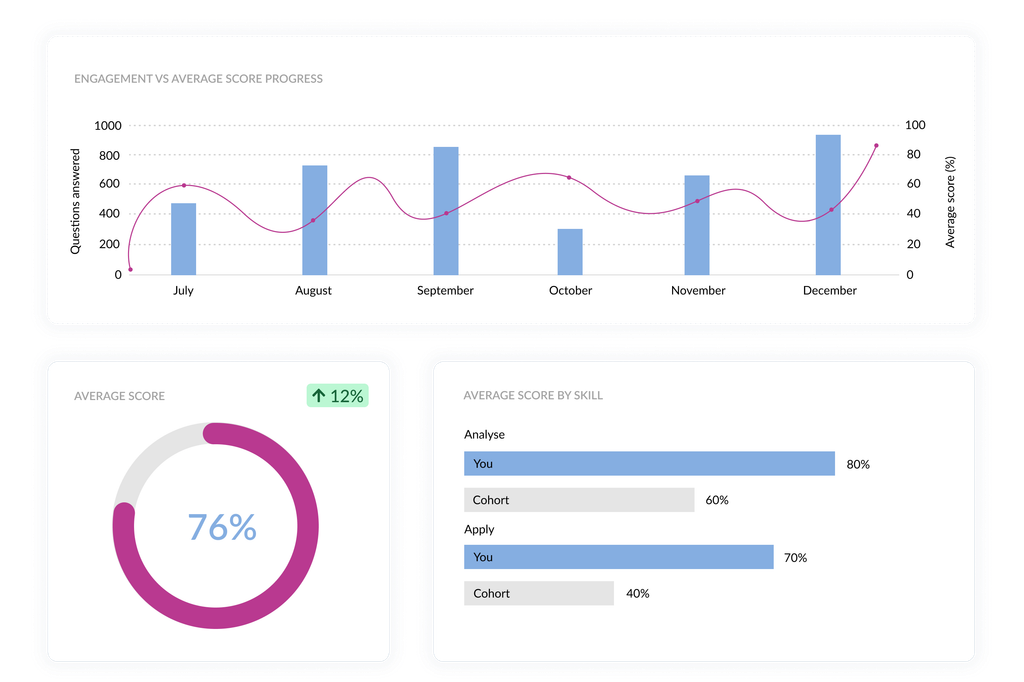
Understand candidate strengths, gaps, and engagement
Quickly spot performance trends and see how engagement affects results. Compare individual scores with cohort averages to ensure fair benchmarking across subjects, skills, and difficulty levels. Flexible filters let you drill into the data by topic or time frame.

Question analysis
Maintain high quality exams with question-level statistics
Ensure exam accuracy and validity with built-in psychometric data that shows how each question performs.
P-value
Determines how easy or difficult a question is with the P-value, showing the proportion of candidates who answered correctly.
Point biserial (Rpb)
Understand how well a question differentiates between high- and low-performing candidates to assess its effectiveness.
Discrimination index
Identify whether a question distinguishes between stronger and weaker candidates, helping improve assessment accuracy.
Option breakdown
Thoroughly analyse distractor performance with a visual breakdown per question, showing the count and percentage of candidates selecting each answer.
Get started
Unlock deeper exam insights with Synap
Book a demo or start a free 14-day trial to explore powerful analytics and reports that track performance and drive smarter assessment decisions.
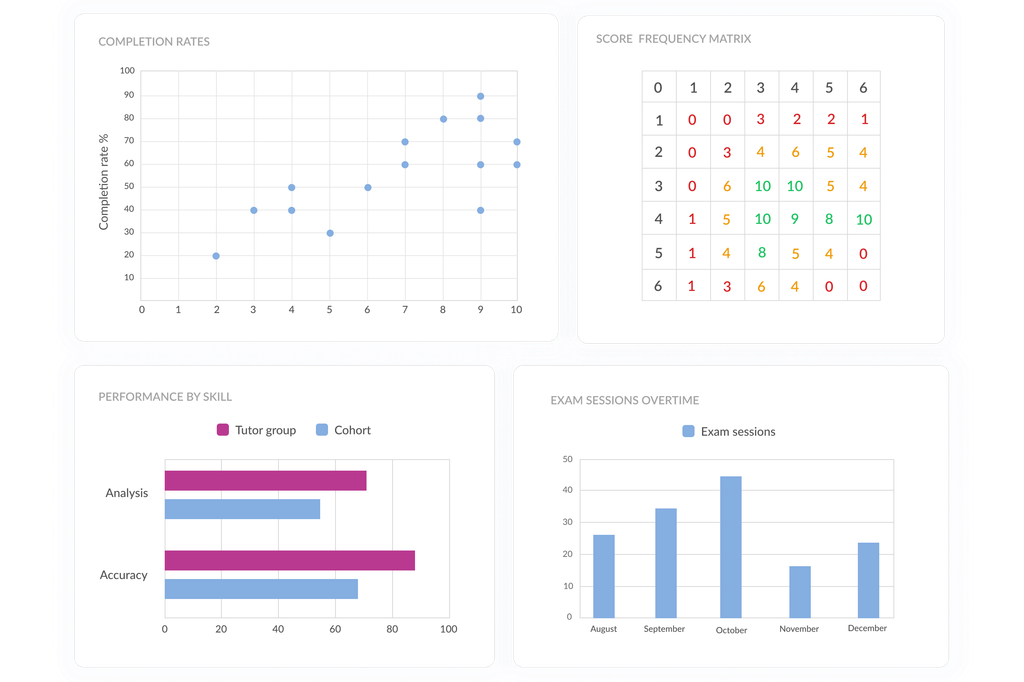
Cohort reporting
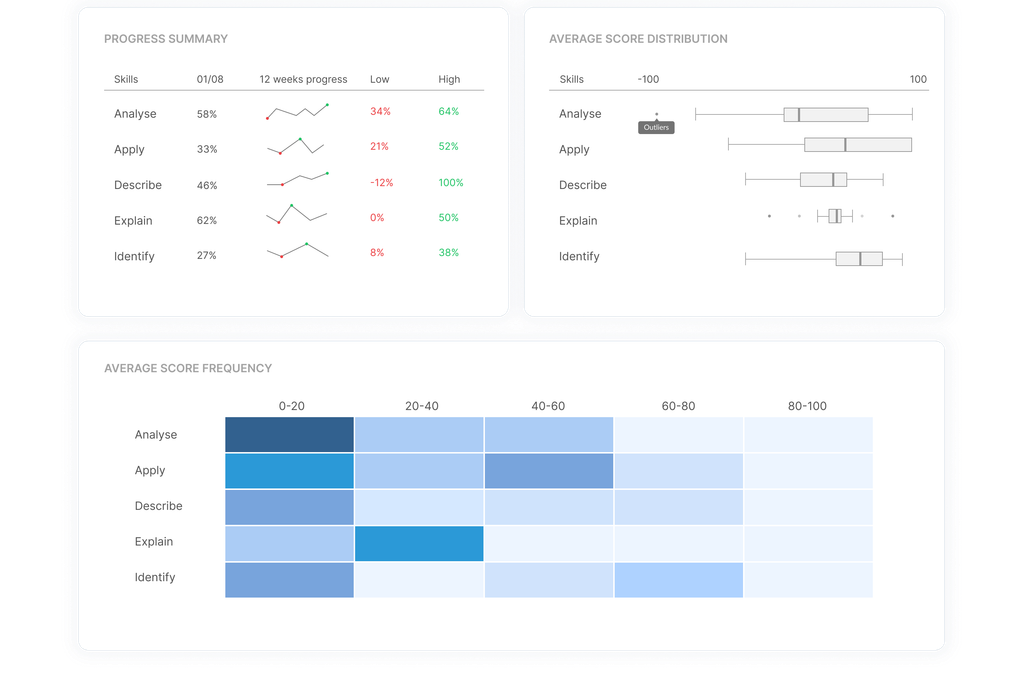
Analyse group trends and outcomes
Track cohort progress with real-time data on skills, performance trends, and variability. Use box plots, line graphs, and heatmaps to spot score patterns, monitor consistency, and identify areas for improvement.
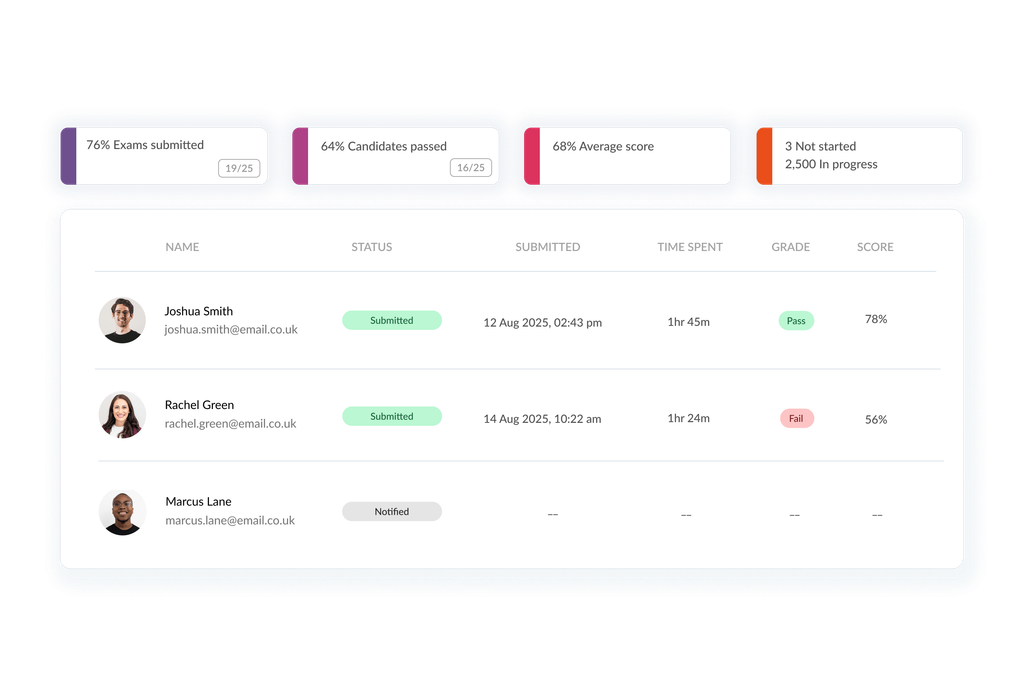
Exam aggregate statistics
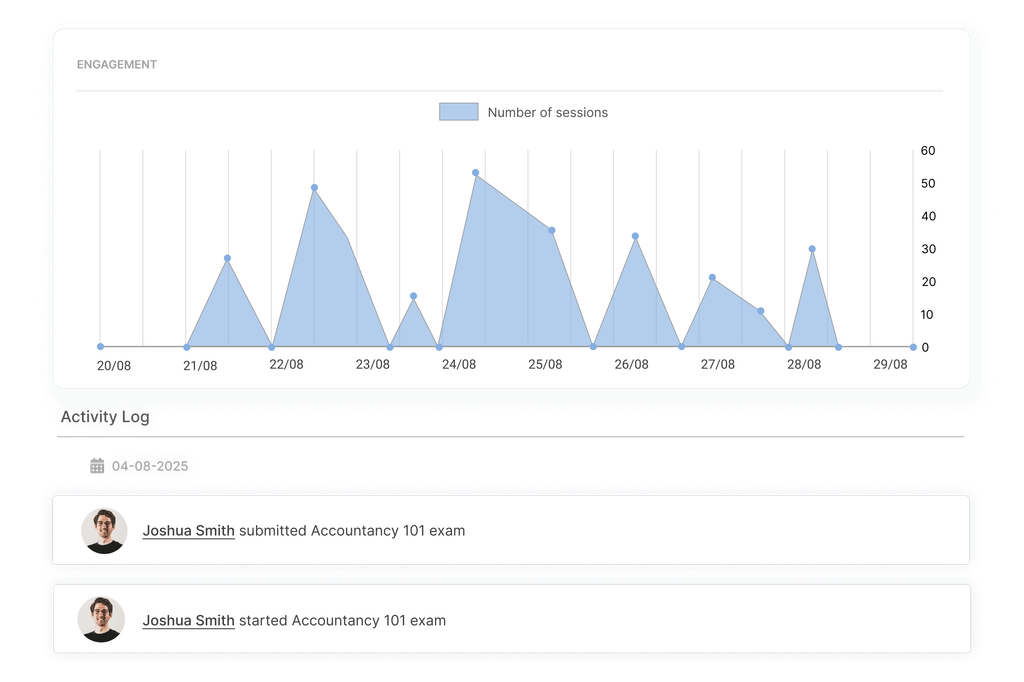
Track exam submission rates
View the percentage of candidates who submitted their exams within each group, helping you monitor engagement and completion rates. A key metric for identifying participation trends or potential barriers to submission.
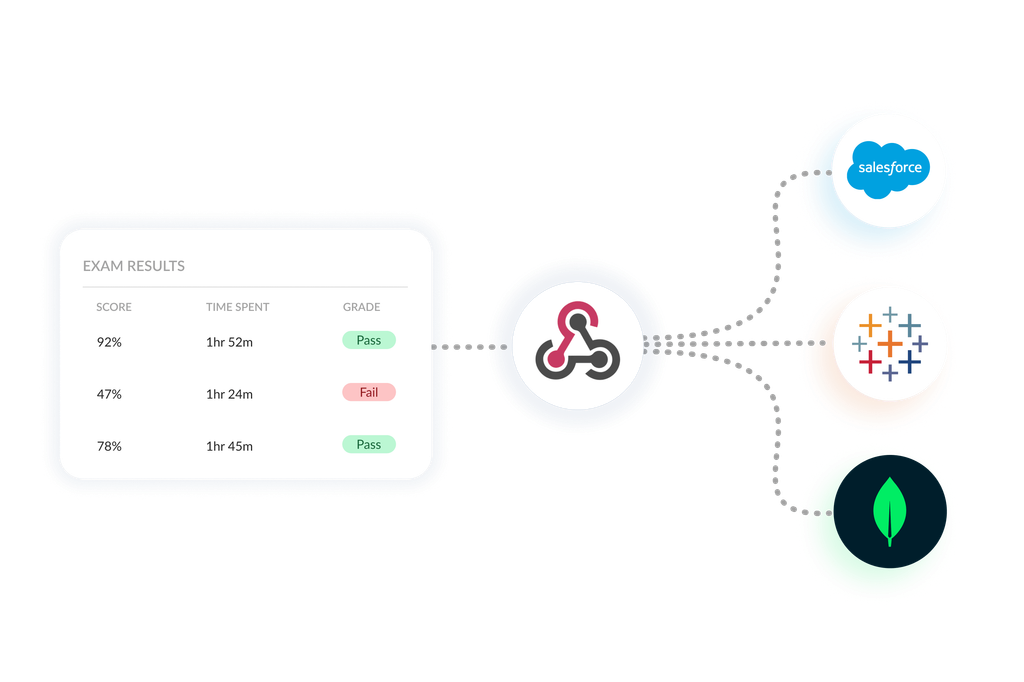
Exporting data
Manually export exam data
Exports give you full control over what data you extract and when, ideal for audits, internal reporting, or sharing with stakeholders. Easily download key performance metrics and reports in CSV format for further analysis or record-keeping.
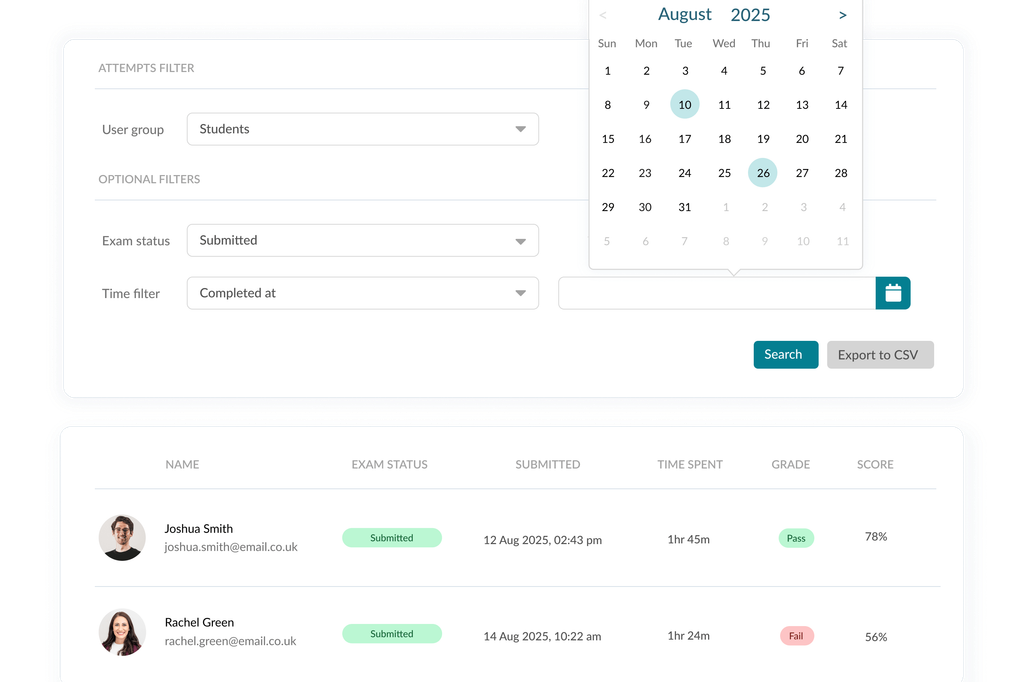
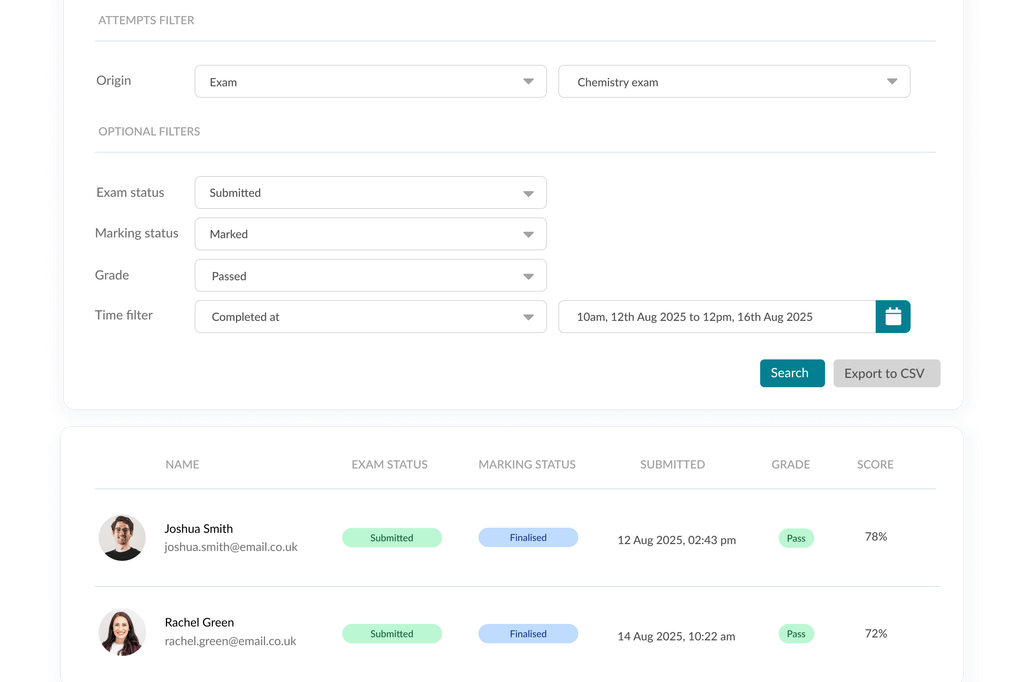
Custom reporting
Generate custom reports with flexible filters
Drill down into the data that matters most and extract targeted insights quickly and easily. Create ad-hoc or standard reports which can be automatically emailed to candidates, managers or admins.
Interested in learning more about Synap?
Explore how Synap can help save you time and streamline your workload across assessments, exam delivery, and training programmes through a personalised demo.